Watchdog your entire IT environment with Veeam ONE
With data becoming so valuable these days, organizations can’t afford to have their IT systems unavailable even for minutes. Monitoring your environment plays a key role to ensure Availability. You need to be alerted when things could go wrong and when it’s time to fix issues before they negatively impact your business. Veeam ONE does just that, not only for your VMware vSphere and Microsoft Hyper-V virtual environments, but also integrates with Veeam Backup & Replicationand, starting with Update 3, provides visibility for Veeam Agents as well.
In this blog post, I will talk about some of the Veeam ONE capabilities that will help you keep an eye on your IT systems.
Categorizing your infrastructure objects
Veeam ONE helps you categorize objects inside your infrastructure by business unit, department, purpose or SLA by means of its Business View component. This business categorization is integrated with Veeam ONE Monitor, enabling you to monitor, troubleshoot and report on business groups of VMware and Hyper-V objects.
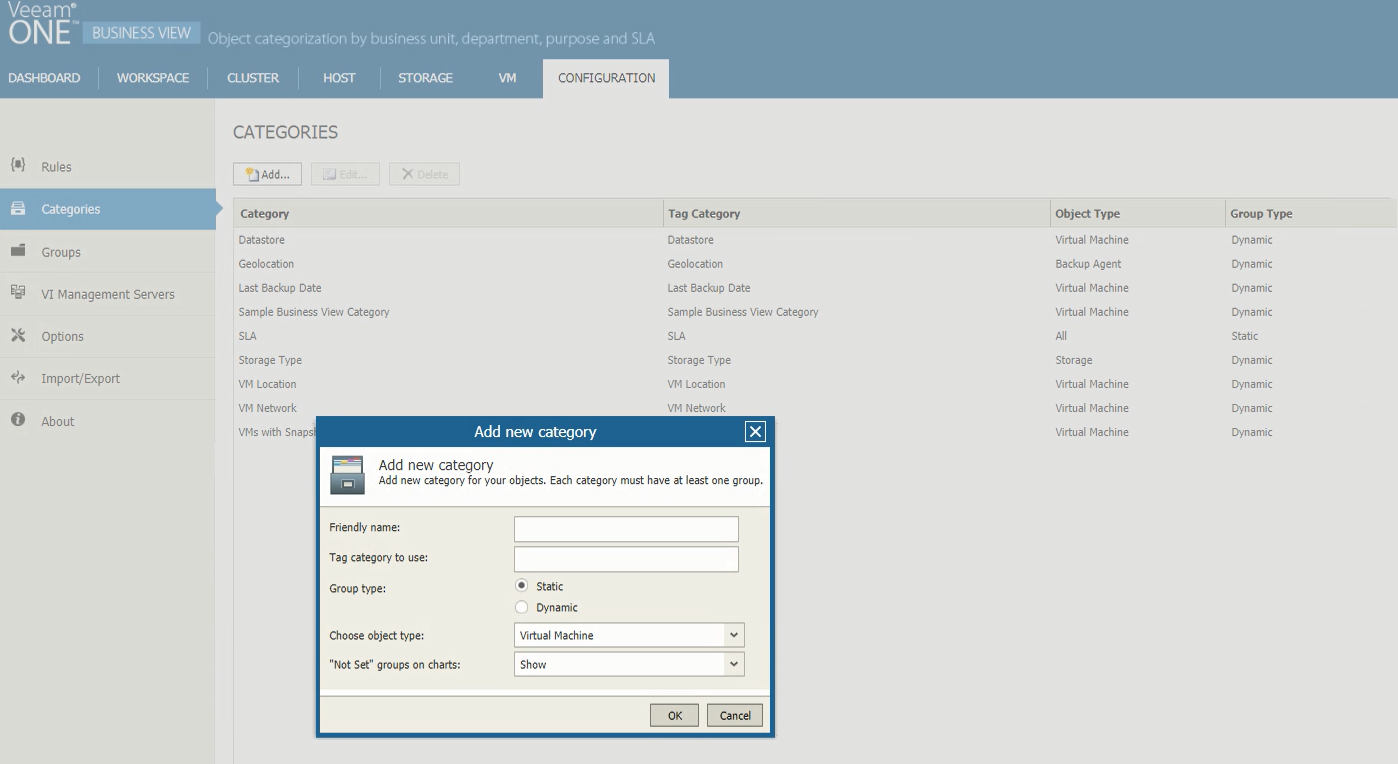
The Configuration tab allows you to configure the basic application settings
After adding business categories into Veeam ONE, you can start monitoring your business groups through the Business View tab in Veeam ONE Monitor.
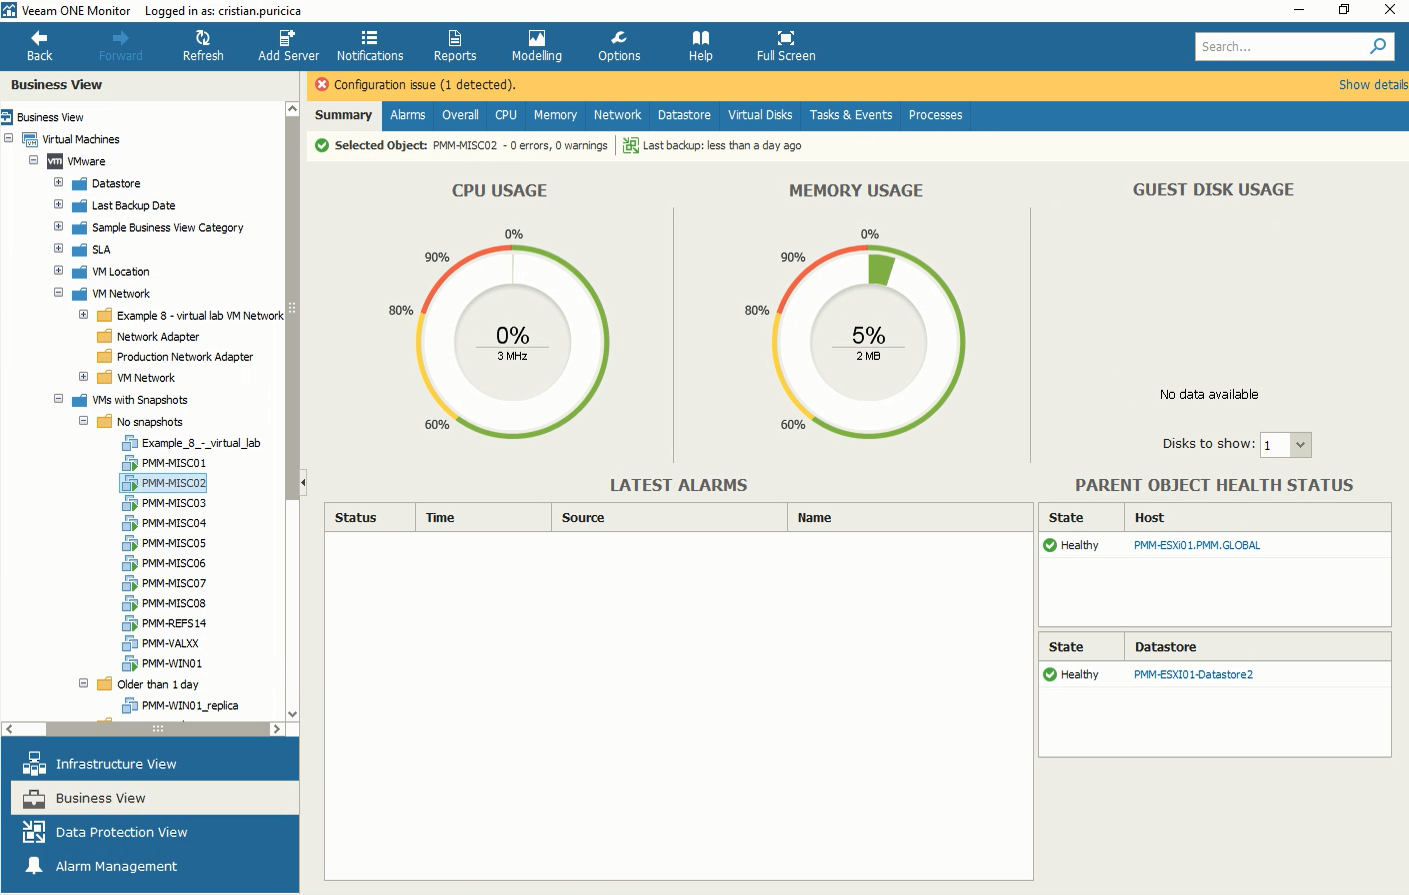
Business View in Veeam ONE Monitor, showing a virtual machine in the VMs with Snapshots category
You can also build reports for specified categories of objects. In the Workspace view of Veeam ONE Reporter, when you select a report, you can either choose to get details on the entire virtual environment, or on specific business view objects. For example, if you group VMs by department, you can create reports for a specific department in your organization.
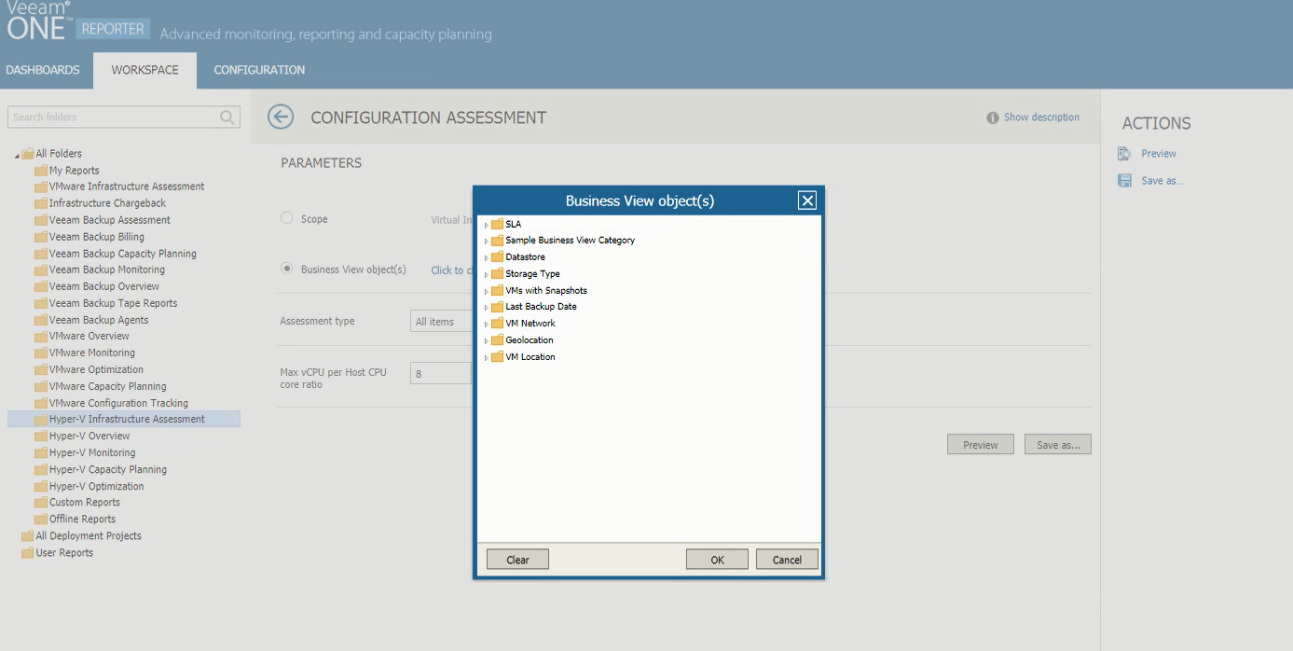
The Business View objects window in Veeam ONE Reporter
Using alarms
There are predefined alarms in Veeam ONE for VMware vSphere and vCloud Director, Microsoft Hyper-V, Veeam Cloud Connect, Veeam Agents, and for internal Veeam ONE issues. All of them are designed to alert IT admins when any notable events or issues occur in their environment. With these alarms, you can easily identify, troubleshoot issues and quickly act to keep business operations running.
If they are used properly, alarms can be a critical method to notify you about the performance of your virtual environment. It’s important to know that too many alarms can lead you to ignore them, while too sensitive triggers can lead to false alarms.
The predefined alarms are built on best practices thresholds and trigger when the parameters defined in the alarm are different against collected data from the virtual and backup servers.
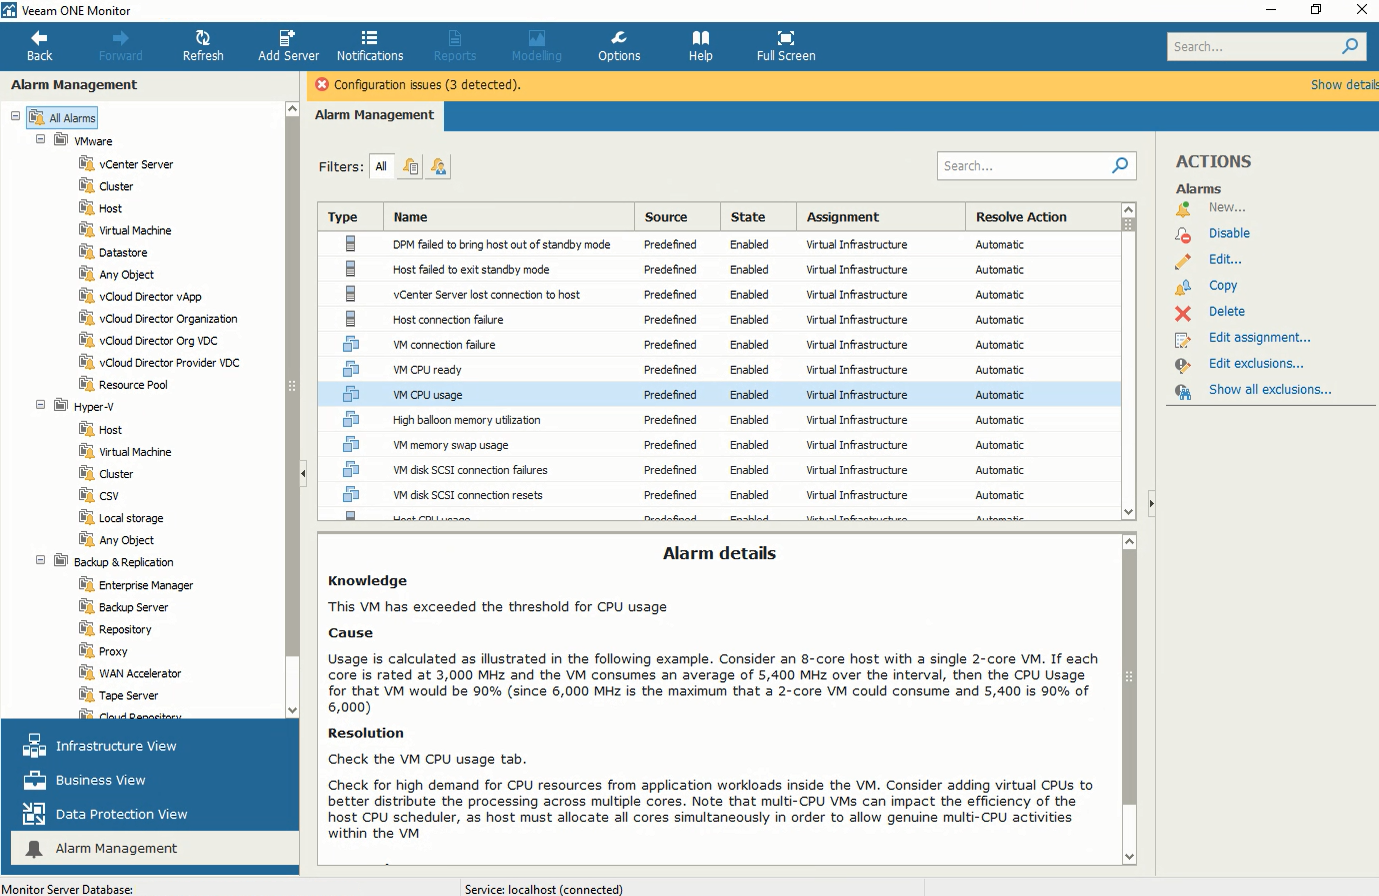
Alarm details in the Alarm Management tab. You can create custom alarms for any kind of tasks and events
When an alarm is triggered, the Veeam ONE console displays details about the root cause of the issue and some ways of resolution. Veeam ONE alarms are customizable and you can edit them to fit your business needs by adding different rules, changing thresholds or assigning them to different objects. You can also choose to send an email to a group when alarm’s severity changes or to suppress an alarm during scheduled activities. Moreover, in the Knowledge base tab you can add custom text to help you with solving the alarm next time it’s triggered.
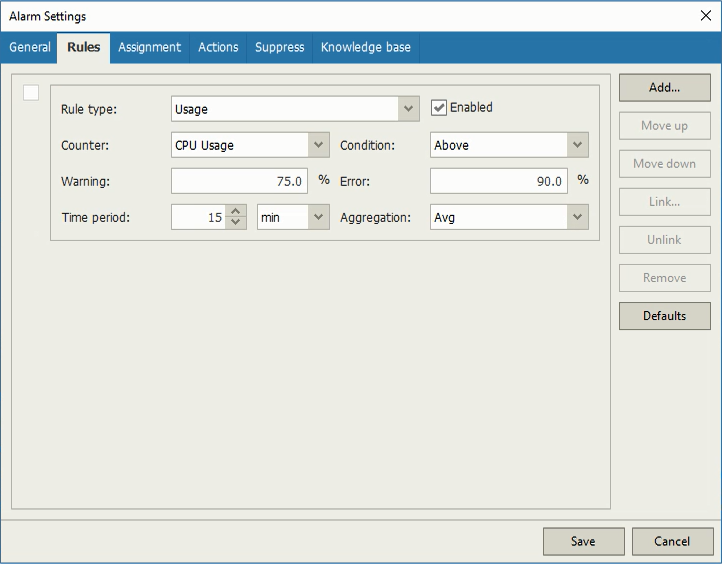
Alarm Settings
Performance and health state monitoring
Veeam ONE enables you to monitor the performance of your VMware vSphere or Microsoft Hyper-V environment through comprehensive charts. In Infrastructure View, you can find information about the latest alarms, CPU, memory and disk resources for different timeframes, as well as network usage details. As you browse in the Infrastructure tree, the Summary tab will display different information for different objects and the rest of the tabs will vary too as you move deeper in the environment.
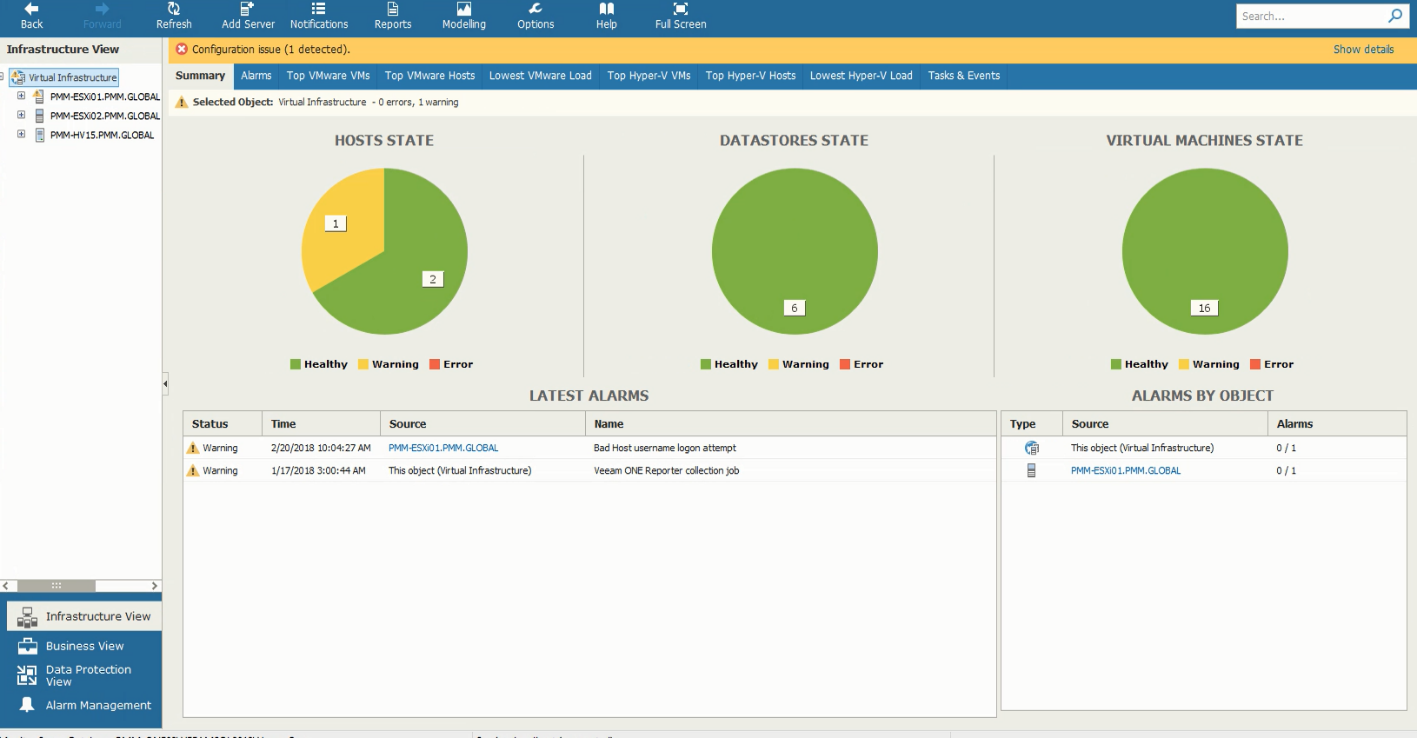
If the parent object is selected, the Infrastructure Summary tab will display the health state overview, including the Host State, Datastores State and the Virtual Machines state.
Along the navigation menu, Veeam ONE Monitor also provides details about Alarms (as you saw earlier in this post), as well as very well-organized metrics on resource consumption. Here you can check the VMs and hosts that use the most resources (CPU, memory, network usage and more), but also the hosts with the lowest load. These stats are available for both VMware vSphere and Microsoft Hyper-V environments.
The CPU chart shows the amount of used processor resources on a machine where a backup infrastructure component runs. Graphs in the CPU chart illustrate the level of processor usage for every separate CPU on the machine. The Total graph shows the cumulative processor utilization for all CPUs.
Capacity planning
While Veeam ONE Monitor provides extensive visibility over your IT infrastructure, the Reporter makes it easy for IT administrators to obtain detailed analysis of their virtual infrastructure and helps to take the guesswork out of capacity planning.
In virtual environments, capacity planning is a critical task for housekeeping and allows IT admins to make correct decisions based on accurate forecasts. The first thing we can see in Veeam ONE Reporter is the VMware Capacity Planning dashboard, which includes few widgets that offer a sneak peek into the more detailed reports of the infrastructure.
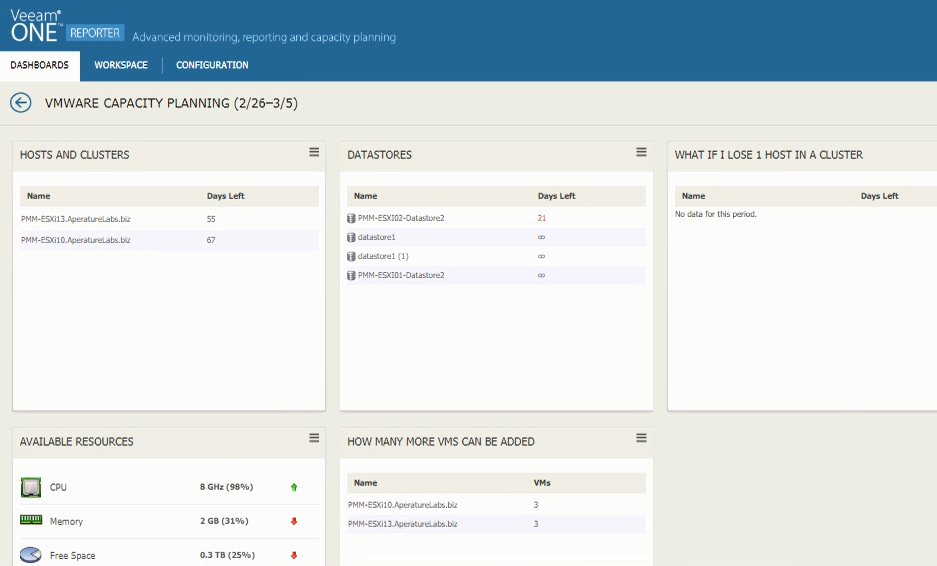
The VMware Capacity Planning dashboards displays details about Hosts and Clusters, Datastores, loss of a host and how many VMs can be added to the infrastructure without having to purchase more resources
Now let’s take a look at the capacity planning reports that we have available: Capacity Planning, Host Failure Modelling, How Many More VMs Can be Provisioned and Over-provisioned Datastores.
The reports are based on collected and analyzed historical data and they are very customizable, allowing you to choose individual or all datastores, set limits for CPU and Memory, select timeframe of the analyzed performance data, as well as the period of planning.
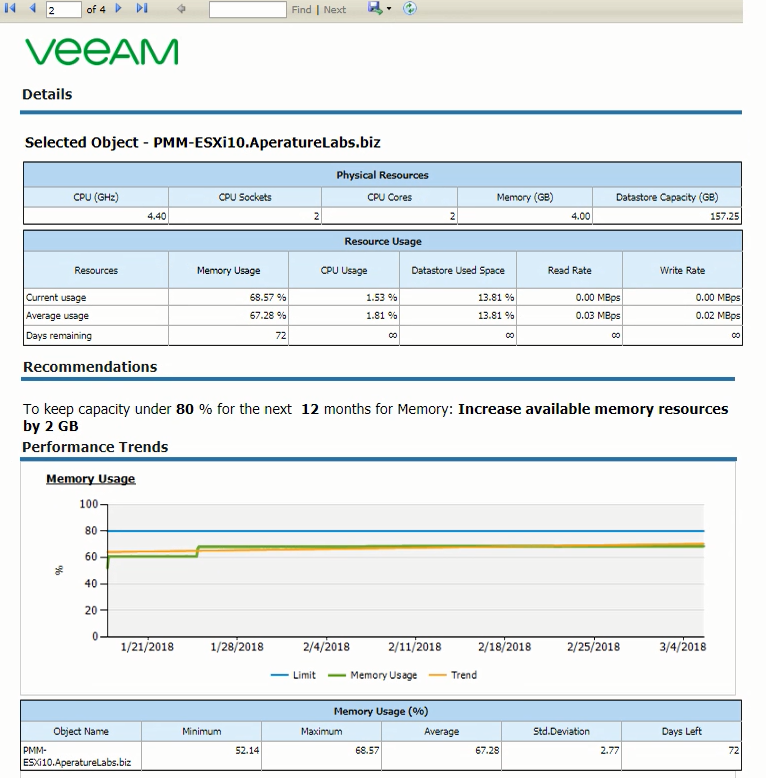
The Capacity Planning report provides very detailed forecast on my virtual infrastructure
At the end of the day, the capacity planning exercise helps you answer some simple questions: Do I have enough resources for more virtual machines? When will I run out of resources? Don’t underestimate these questions, they may save you time and money one day.
Agents monitoring and reporting
Update 3 came with many new features for Veeam Backup & Replication 9.5 and Veeam ONE 9.5, and one of the most highly-anticipated is agent management. Veeam ONE 9.5 now supports agent monitoring and reporting for Veeam Agent for Microsoft Windows and Veeam Agent for Linux, enabling you to have visibility into both your virtual and physical infrastructures.
You can have real-time monitoring and alerting for the Veeam Agent jobs managed by Veeam Backup & Replication servers that you monitor in Veeam ONE. To do so, go to Data Protection view in Veeam ONE Monitor and open the Agent Jobs tab of the desired backup infrastructure node. For each job, you will gain information such as the status of a backup job (Success, Warning, Failed, Running, or jobs with no status), backup job name, type, transferred data and more.
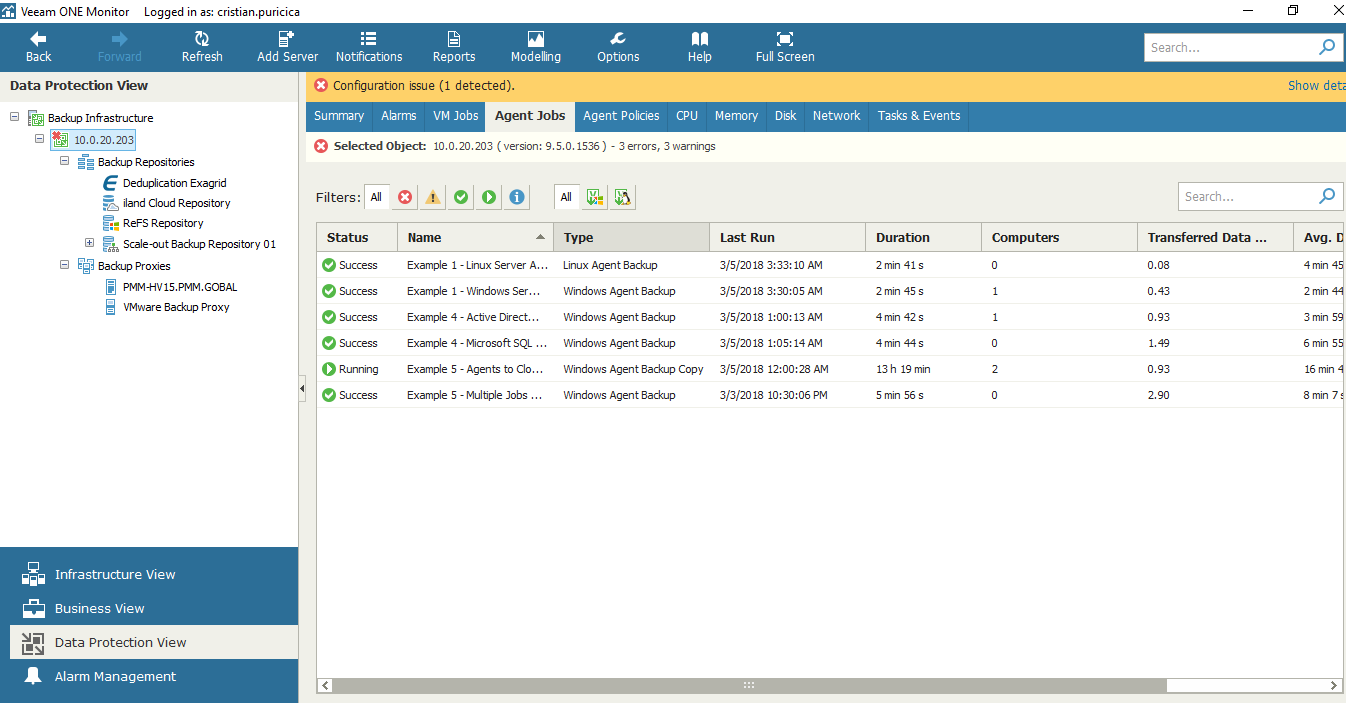
Veeam Agent jobs in Veeam ONE Monitor
In the Veeam Backup Agents report you can choose to include business groups (defined in Veeam ONE Business View) or Veeam Backup & Replication servers and protection groups. Likewise, you can choose to include in the report either specific Veeam backup agents or backup jobs and policies.
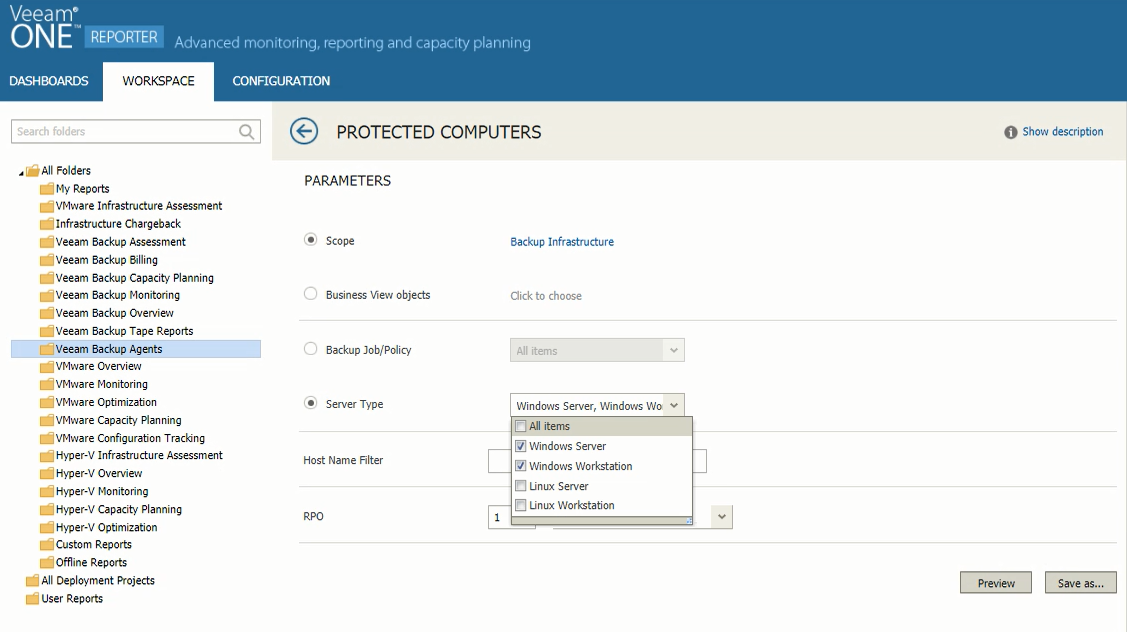
Selecting the report’s parameters
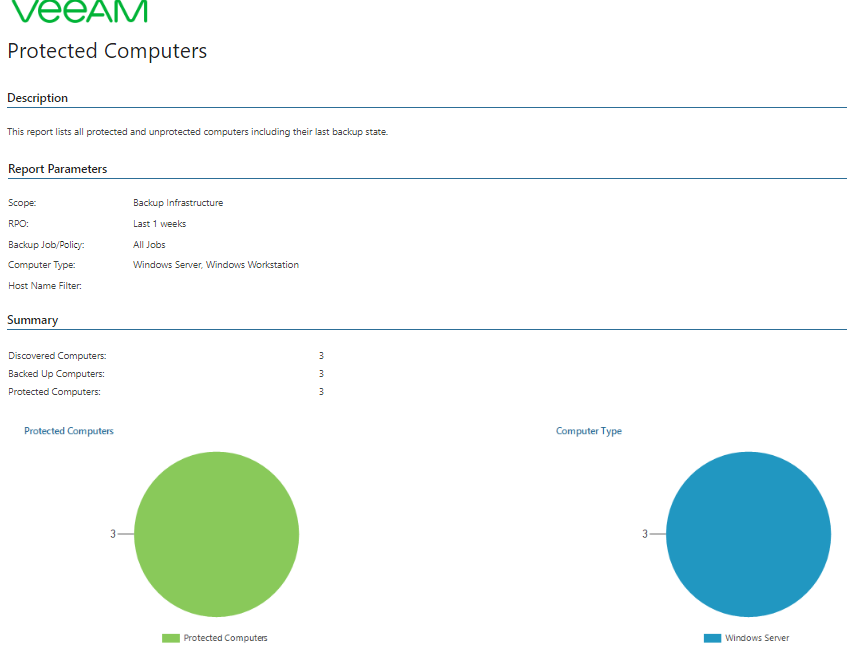
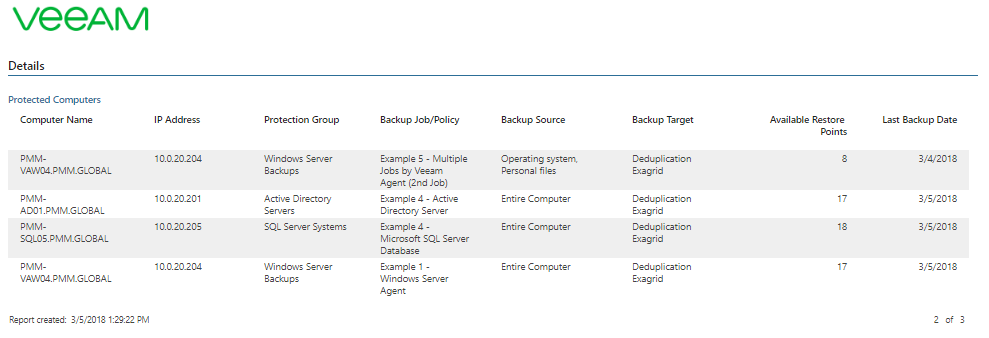
In my example, I chose to have a report for Windows-only machines with the RPO (Recovery Point Objective) of 1 week, meaning I will get a list of computers protected weekly. On the second page, you’ll find a detailed list of protected and unprotected computers, including information like IP address, Backup Job/Policy, Last Backup Date and more.
Conclusion
Monitoring your entire IT infrastructure can often be overlooked. This is a mistake that can not only cost your business money, but also its reputation. Minor breaches, due to their complexity, can cause performance issues in virtual and physical environments. However, this can be avoided with a good monitoring tool that alerts you when things are not working as they should. Veeam ONE provides a comprehensive set of alerts and a very user-friendly interface that facilitates visibility, troubleshooting and resolving issues.
This article was provided by our service partner Veeam